See exactly where you stand for the SIE — and what to do next.
Your real practice and mock answers become one readiness estimate against the 70% pass line, plus your weak areas, your study habits and today's plan. Every number points to an action — no streaks, no points.
"Am I ready?" shouldn't be a guess.
A dashboard is only useful if it answers two questions: where am I, and what should I do next. PrepScore reads both straight from your answers — and refuses to fake the parts it can't measure yet.
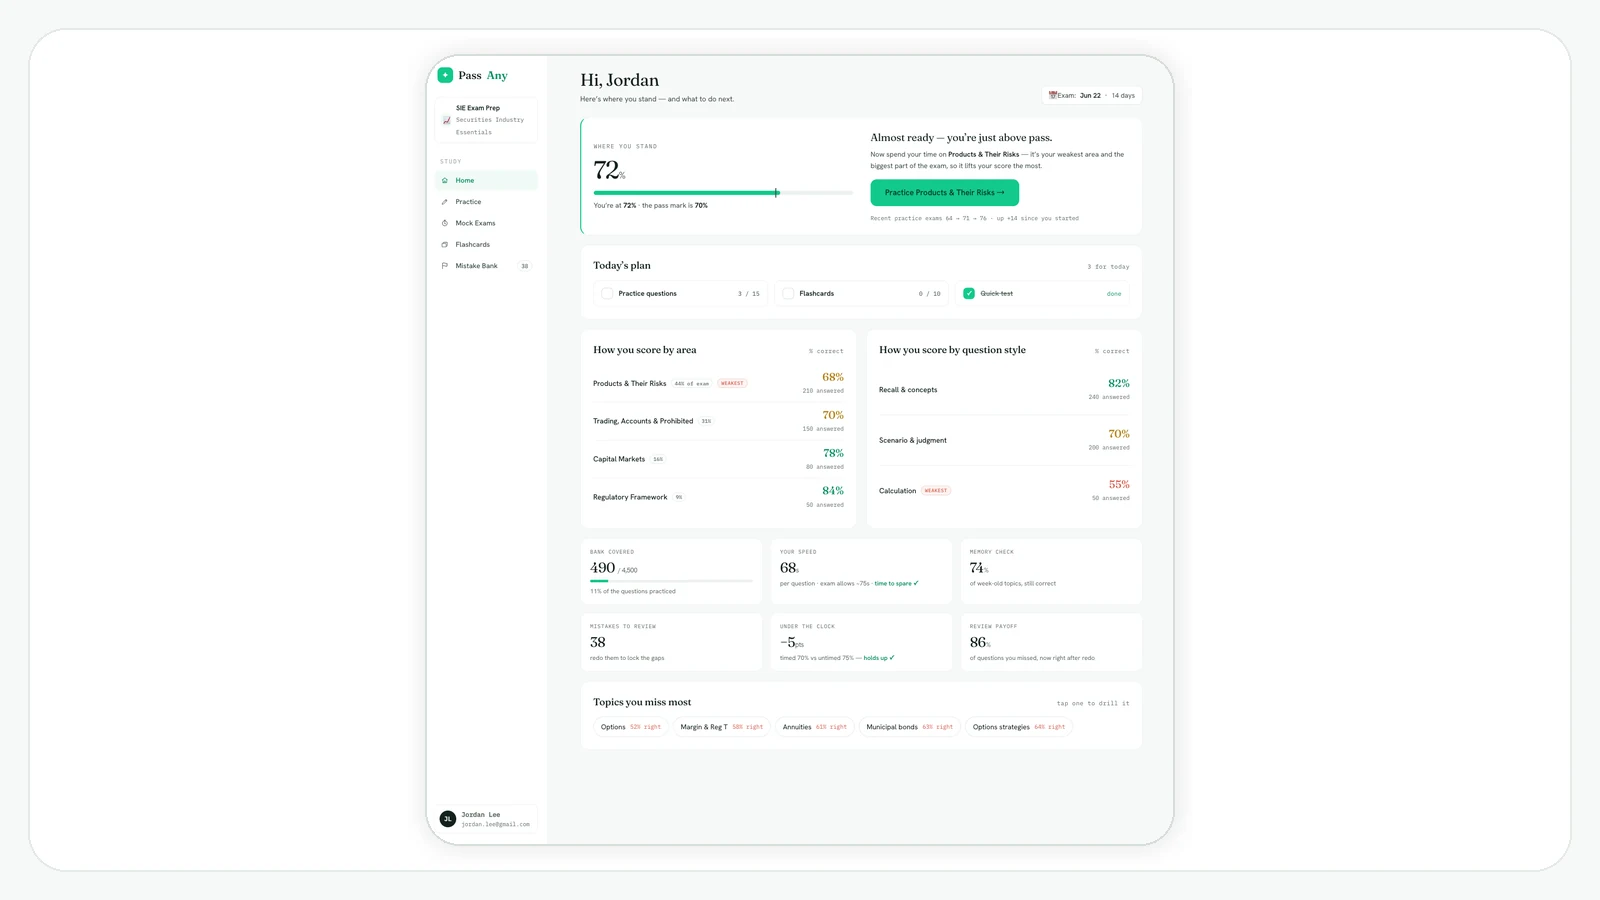
One readiness number, against the pass line.
Weighted like the real exam and marked against 70%, so "ready" is a measurement — not a feeling. Thin data shows "calibrating," never a made-up score.
A score that tells you what to do.
It names the one domain that moves your score most right now, with a button straight to practicing it — not just a percentage to stare at.
No streaks, no XP, no vanity.
Every tile maps to a study action. We don't gamify studying — we point you at the next useful thing and get out of the way.
One readiness estimate, weighted like the real exam.
Your accuracy in each FINRA domain is combined using the exam's own 16 / 44 / 31 / 9 weights, then measured against the 70% pass line. You see the gap to a pass, the highest-leverage domain to attack, and your last few mock scores.
- Weighted to the official 16 / 44 / 31 / 9 blueprint
- Marked against the 70% SIE pass line
- Names the focus domain that moves your score most
- Shows "calibrating" until you've answered enough — never a faked number
Not just your score — where, and what kind.
Two scorecards sit side by side. One breaks your accuracy down by the four FINRA domains, flagging your weakest. The other splits it by question style — so you can tell a knowledge gap from a test-taking one.
How you score by area
By question style
The habits a single score hides.
Six tiles that each answer a real question about whether you're ready — and each points to what to do about it.
Plus Topics you miss most — your weakest subtopics, each a tap into focused practice. Every signal stays blank until it has enough of your answers to be honest.
It opens on what to do today.
The top of the dashboard carries your exam-date countdown; below it, a short fixed plan for today — some questions, your due cards, one timed drill. Check them off and the dashboard moves on with you.
- Days-to-exam countdown, set from your test date
- Three focused tasks for today, with progress
- Resets each day — no backlog guilt
Reads from, points to
Useful for searches like
- SIE readiness / am I ready for the SIE
- SIE progress tracker by domain
- SIE weak-area dashboard
- SIE study analytics
SIE dashboard questions
What does the readiness score mean?
How is the dashboard different from the study plan?
Are there streaks or points?
What are the six study signals?
Stop guessing whether you're ready.
Start free — answer a few questions and the dashboard starts reading where you stand.